Smart Menus, Smarter Sales: A Guide to Market Basket Analysis for Restaurants
Discover how Market Basket Analysis helps restaurant platforms generate smart combos, personalize menus, and integrate analytics.


Erum Sanwari
Technical Consultant


Modern restaurant chains collect millions of order transactions from apps, point-of-sale systems, and delivery platforms. Hidden within that data are rich insights: which items tend to be ordered together, how combos evolve over time, and how regional preferences differ. Yet many such statistics are still manually defined. This creates missed opportunities such as
-
Static combos like “Burger + Fries + Coke” are updated sporadically, failing to reflect sudden changes in customer behavior or new menu patterns.
-
Regional specifics are ignored, like some items may be a hit in one region and a miss in another.
-
Manual configuration means more time lag, slow adaptations to shifting demands, and missed revenue sources.
Most restaurants and food platforms collect massive order data, but rarely use it beyond basic dashboards. Market Basket Analysis (MBA) flips this script. By analysing transaction-level purchase patterns, MBA uncovers item associations backed by data, for example, that customers ordering shawarma and garlic dip frequently add mineral water, or that users buying spicy wings are more likely to choose a milkshake. These insights empower teams to:
-
Automatically generate dynamic combos
-
Push contextual combo suggestions
-
Adapt menus at a branch or even hourly level
MBA translates raw transactional data into sales action. For restaurant platforms built on Ruby on Rails, these insights can be directly integrated into ordering workflows, enabling real-time combo suggestions, intelligent upsells, and automated menu optimization without manual intervention. Rails applications can capture transaction data, trigger analytics pipelines, and display dynamic combos seamlessly within web and mobile ordering interfaces.
In this blog, we explore how to implement MBA end-to-end from ingesting order records to generating combo rules and measuring impact.
What Is Market Basket Analysis?
Market Basket Analysis is a data mining technique for analysing a collection of items to identify relationships and affinities between them. It involves studying patterns of purchase by shoppers to find out which items are frequently bought together.
When you go to a market, you grab a shopping cart and walk past aisles of different items. You may pick a few items as planned and the rest spontaneously, grabbing as snacks, or forgotten groceries. This shopping cart items, and the others are analysed based on the items picked, and patterns are studied to make the items/aisles arrangement better.
For instance, if a shopper picks bread, they are very likely to pick butter, or milk with it. These items can be kept together for increased sales or can be kept separately arranged such that items placed between bread and butter may catch the shopper’s attention and get to be picked by them, for example a little pack of fruit jam or peanut butter.
These arrangements are done based on past patterns identified by data mining, and machine leaning algorithms. When we talk about algorithms, it will involve calculations and equations.
Similarly, Market Basket Analysis (MBA) is also based on certain key metrics which we are going to see in the next section.
Association Rules
Association Rule Mining helps reveal “if‑then” patterns across large datasets. It shows which items often appear together and quantifies the strength of these connections. In retail, for example, a rule might be: “If someone buys bread, they’ll also likely buy butter.”
These rules consist of two parts:
-
Antecedent (the “if”): the conditions that trigger the rule (e.g., bread).
-
Consequent (the “then”): the outcome that follows (e.g., butter).
Algorithms like Apriori or FP-Growth scan transaction records to identify item combinations that frequently co-occur, then score them using metrics such as support, confidence, and lift, allowing teams to prioritize meaningful patterns.
Association rules aren’t limited to commerce — they’re also used in healthcare (e.g., symptom-disease relationships) and marketing (e.g., cross-sell recommendations) — anywhere understanding item associations helps guide smart decisions.
Did you know that Market Basket Analysis can be implemented in several scenarios, even on a restaurant menu? Let us try to explore the rest of the article using our favorite category, food!
Key Metrics in Association Rules
1. Support:
Support is defined as the percentage of transactions containing a particular item or itemset out of the total transactions.
Let us assume out of a total of 10000 orders, 2200 orders included fries. Support is calculated as
Support(Fries) = # of orders with Fries / Total orders
Hence, the support for fries = 22%.
Why it matters: Finding combos that are only rarely purchased (support < 1–2%) may not be worth pushing in your menus.
2. Confidence:
Confidence can be defined as a probability of a customer buying item B when they are buying item A.
If with 2200 orders of Fries, 1000 orders contained Coke, then confidence of buying Coke when Fries are ordered
Confidence(Fries/Coke) = Support (Fries/Coke) / Support (Fries)
Hence, confidence for purchasing Coke when Fries are purchased = 1000/2200 ≈ 45%.
Why it matters: High confidence means that when someone orders item A, the upsell suggestion for B is more reliable.
3. Lift:
Lift is similar to confidence, except that it measures the likelihood than a random chance. It is defined as the measurement of likelihood of buying B WITH A than by a random chance.
Lift (Fries/Coke) = Confidence (Fries/Coke) / Support (Coke)
OR
Lift (Fries/Coke) = Support (Fries, Coke) / (Support (Fries) * Support (Coke))
Hence, Lift for purchasing Coke with Fries if Support (Coke) is 20% = 45/20 = 2.5. This means a Fries order is 2.5× more likely to include a Coke than a random chance.
These metrics help us:
-
Filter for frequently purchased combos (support)
-
Ensure reliable upsell suggestions (confidence)
-
Focus on meaningful relationships, not chance (lift)
Algorithmic Implementation
MBA is typically implemented with the Apriori algorithm, which:
-
Find frequent item sets (high support).
-
Generates association rules from those item sets.
In production environments, this analysis is often executed using Python or data processing tools. Implementing this effectively requires experienced engineers who can build reliable analytics pipelines and production-ready systems.
Many businesses choose to hire Python developers to develop and operationalize these machine learning workflows. These insights are then integrated into customer-facing platforms, where applications built with Ruby on Rails handle data storage, business logic, and real-time delivery of combo recommendations.
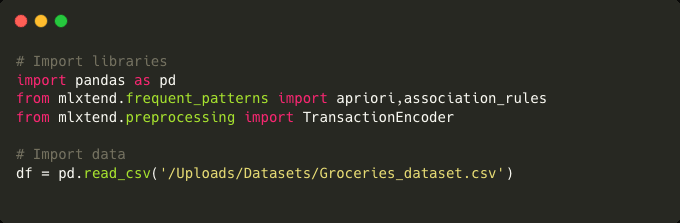
Now, let us explore how we can actually use association rules and the concept of market basket analysis to find or create the right item combos. We would be using a groceries dataset for the practical implementation, which could very well be duplicated with a restaurant menu per our requirement.
The dataset can be found here.
You can find the full notebook link here.
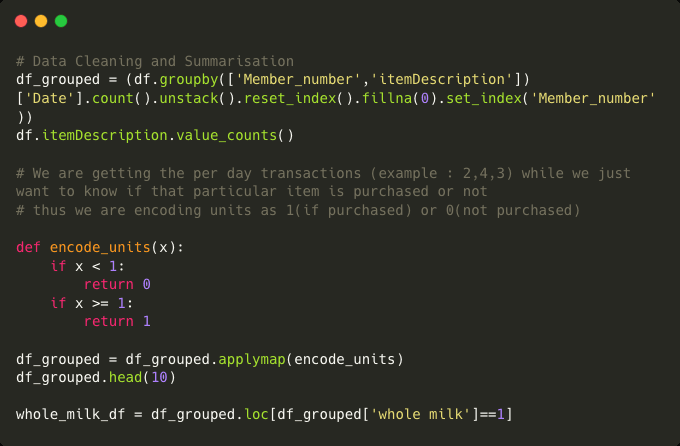
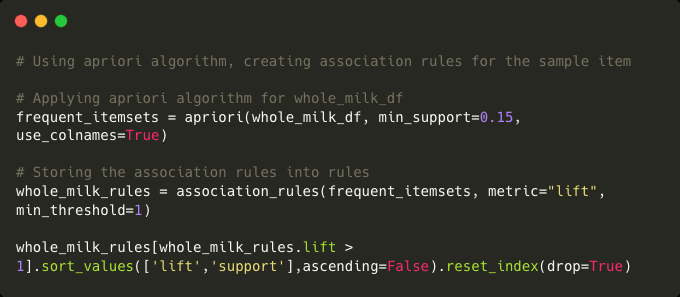
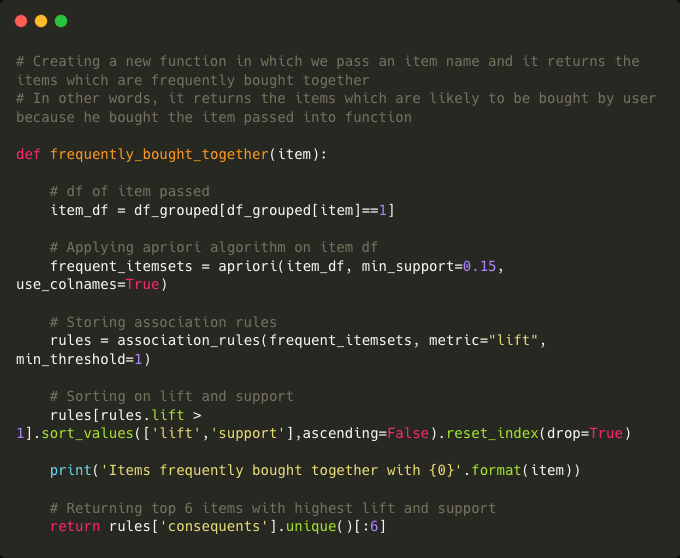
Now, we can check the item combinations with high support, confidence and lift!
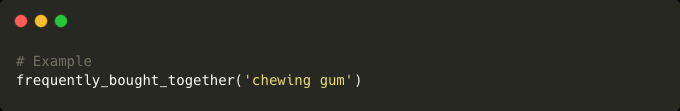
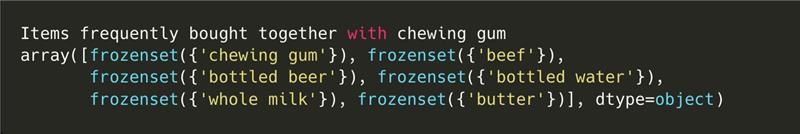
For the first 5 combinations, run the following:

This outputs the following on screen, identifying other items that can be combined with them.
With our whole_milk_rules DataFrame in hand, each row represents one potential “combo” (e.g. {whole milk} → {butter}). The support column tells us how frequently that combo shows up in all transactions; confidence tells us how likely the consequent is given the antecedent; and lift helps us separate “real” associations from coincidences by comparing against overall item popularity.
Next, we’ll plot histograms of these three metrics. This will help us pick sensible thresholds (e.g. support ≥ 0.10, confidence ≥ 0.30, lift ≥ 1.2) for generating only the most meaningful combos in our restaurant setting.
Visualizing the Findings
Now that we have results in front of us, let us plot a histogram for the three metrics on our findings. Run the following,

It returns
array([[<Axes: title={‘center’: ‘support’}>, <Axes: title={‘center’: ‘confidence’}>], [<Axes: title={‘center’: ‘lift’}>, <Axes: >]], dtype=object)
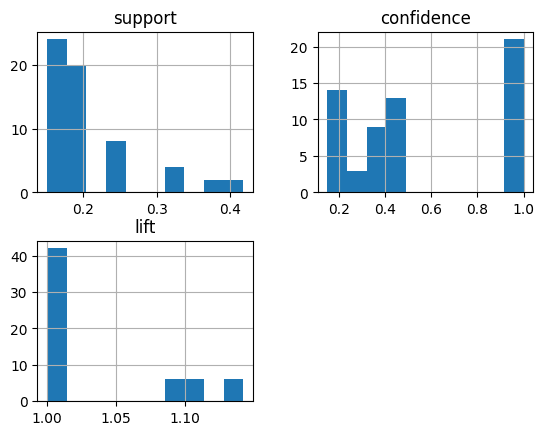
The three histograms above reveal:
-
Support is heavily skewed toward lower values, indicating most item pairs occur in only a small fraction of orders. We’ll likely focus on rules with support in the 10–20% range and above.
-
Confidence shows a wider spread — some rules are nearly guaranteed (confidence ≈ 1.0), while others hover around 0.2–0.4. We can choose a confidence cutoff (for example, 0.5) to ensure our suggested combos are reliable.
-
Lift clusters around 1.0, which is the “no‑effect” baseline, but the right‑hand tail (lift > 1.1) points to genuinely interesting pairings that occur more often than chance.
By combining these insights, we can now zero in on the best candidate combos for our menu automation: those that are frequent enough, dependable enough, and surprisingly strong in lift.
Final Words : Creating a transition from grocery store to restaurant menu
While our grocery-store example neatly demonstrates how Market Basket Analysis uncovers “beer + butter” or “napkins + onions” associations, the same principles apply directly to a restaurant’s menu. Instead of shopping carts filled with pantry staples, imagine digital carts holding shawarma wraps, curly fries, and Coke!
By swapping in your restaurant’s order data and adjusting support–confidence thresholds to reflect menu diversity, you’ll surface the most profitable item sets, whether that’s “spicy wings + milkshake” for late‑night cravings or “family meal combo” on weekends.
For restaurant businesses running custom ordering platforms, especially those built with Rails, integrating Market Basket Analysis can become a powerful competitive advantage. However, implementing end-to-end data pipelines, analytics engines, and intelligent menu systems requires thoughtful architecture and engineering expertise.
Investing in the right custom software solutions and foundation ensures these insights translate into measurable revenue growth.